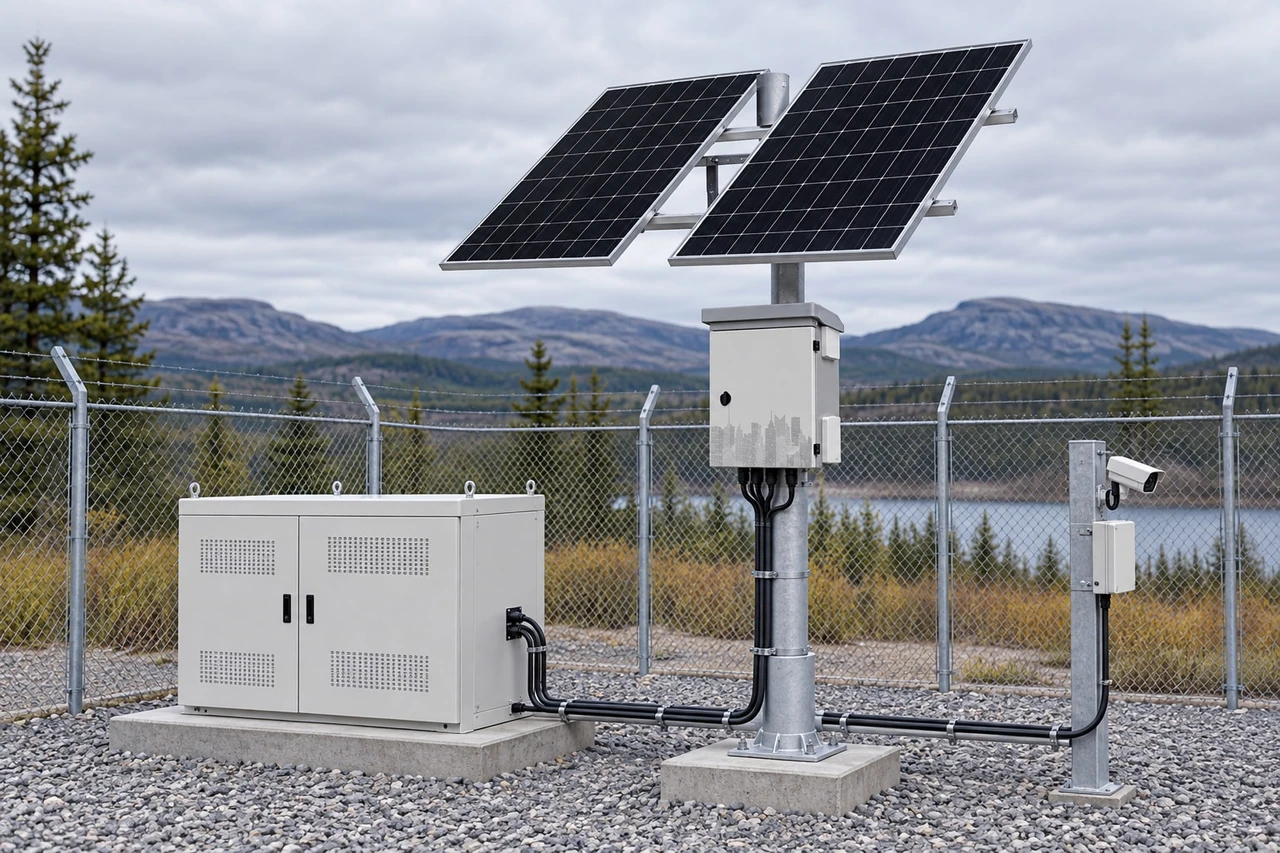
Solar Panel, Battery and MPPT Sizing Worksheet
Use a coordinated worksheet to size daily load, battery storage, PV array and MPPT limits for an off-grid solar system in New Zealand.
By Maxsol Team

A reliable solar panel battery MPPT load calculation starts with the equipment load, then sizes battery storage, the PV array and finally the controller. These parts cannot be selected independently: changing operating hours or winter autonomy affects the battery, which affects recharge requirements, controller current and potentially the entire system voltage.
For a defensible design, use one worksheet with clearly stated assumptions. Calculate energy in watt-hours rather than comparing watts alone, use solar data for the actual New Zealand site and design month, and validate every result against current panel, battery and controller datasheets.
Create the load and daily energy worksheet
List every device, its measured or specified input power, operating hours and any variation between daytime and night-time operation.
The basic daily energy formula is:
Daily energy (Wh/day) = power (W) × operating time (hours/day)
For several devices:
Total load energy = sum of each device’s daily energy
A practical worksheet might look like this:
| Load | Quantity | Power per device | Hours per day | Daily energy |
|---|---|---|---|---|
| Security camera | 3 | 7W | 24 | 504Wh |
| Wireless bridge | 1 | 8W | 24 | 192Wh |
| Network switch | 1 | 6W | 24 | 144Wh |
| Total connected load | 840Wh/day |
These figures are hypothetical. Actual camera consumption can change when infrared illumination, heaters, pan-tilt motors or other functions operate. Wireless equipment may also draw more power during high traffic or poor link conditions.
Account for conversion and cable losses
The connected load is not always the energy that must leave the battery. Cable voltage drop, DC converters, PoE conversion and other electronics consume additional energy.
If the example above had an assumed overall downstream efficiency of 90%:
Battery-side daily energy = 840Wh ÷ 0.90 = 933Wh/day
Efficiency must not be guessed when dependable operation matters. Use measured consumption where possible and check the efficiency curves of converters at the expected load.
Also record:
- Continuous power in watts
- Peak or start-up power
- Day and night operating profiles
- Seasonal loads, including heaters or ventilation
- PoE switch consumption in addition to powered-device consumption
- Cable length, conductor size and expected voltage drop
- Any scheduled load shedding or reduced-power mode
For a surveillance-specific walkthrough, see the guide to sizing an off-grid solar power system for CCTV.
Size battery storage from autonomy assumptions
Battery capacity is determined by daily energy, desired autonomy, usable depth of discharge, discharge efficiency and any required allowance for ageing or temperature.
A transparent starting formula is:
Nominal battery energy (Wh) = daily battery-side energy × autonomy days ÷ usable fraction ÷ discharge efficiency
Using the hypothetical 933Wh/day load, two days of autonomy, an 80% usable fraction and 95% discharge efficiency:
Battery energy = 933 × 2 ÷ 0.80 ÷ 0.95 = 2,455Wh
For a nominal 12.8V battery:
Battery capacity (Ah) = 2,455Wh ÷ 12.8V = approximately 192Ah
This does not mean that every 12.8V 192Ah battery will provide identical service. Confirm the battery manufacturer’s limits and operating conditions.
Define autonomy carefully
“Two days of autonomy” should mean the battery can support the stated load for two design days without meaningful PV contribution. It does not promise continuous operation through an indefinite period of poor weather.
Longer autonomy increases battery capacity, but it may also increase:
- The energy that must eventually be replaced
- Required PV array power
- MPPT charge-current capacity
- Cable and protection requirements
- Recovery time after prolonged low solar input
Avoid using nominal watt-hours as if all stored energy reaches the load. Battery management system cut-offs, discharge efficiency, converter losses, temperature and reserve settings all reduce delivered energy.
Check the complete battery voltage profile
A nominal 12V or 12.8V label is not enough for system coordination. Record:
- Maximum permitted charge voltage
- Normal charging voltage range
- Resting and operating voltage
- Low-voltage warning and disconnect thresholds
- Maximum continuous and peak discharge current
- Maximum recommended charge current
- Battery management system cut-off behaviour
- Permitted charging temperature range
LiFePO4 batteries require particular attention to low-temperature charging restrictions. Confirm whether charging is blocked, reduced or otherwise managed at low cell temperatures. Do not assume the controller and battery provide compatible protection without checking both datasheets.
Estimate PV energy for the design month
PV sizing should use the least favourable month in which the system is required to meet its design target, rather than an annual average. For New Zealand sites, winter solar availability, local terrain, panel orientation, shading and extended cloudy periods can materially affect the result.
A simplified first-pass formula is:
Required PV power (W) = daily energy requirement (Wh) ÷ design peak sun hours ÷ system derating factor
If the hypothetical system requires 933Wh/day, receives 2.5 peak sun hours in its design month and uses a 0.70 overall PV derating factor:
Required PV power = 933 ÷ 2.5 ÷ 0.70 = approximately 533W
This is an energy-balance estimate, not a complete system specification. The derating factor may need to cover panel temperature, orientation, dirt, mismatch, wiring and controller losses. Avoid inserting arbitrary margins in several places, as stacked allowances can conceal how the design was derived.
Include battery recovery, not just daily operation
An array sized only to replace an average day’s load may take too long to recharge a depleted battery. A more complete calculation adds a recovery target:
Required daily PV energy = daily operating energy + recoverable battery deficit ÷ recovery days
Suppose the design calls for replacing a 1,866Wh battery deficit over three suitable solar days:
Recovery allocation = 1,866Wh ÷ 3 = 622Wh/day
Total PV energy target = 933Wh + 622Wh = 1,555Wh/day
With the same hypothetical 2.5 peak sun hours and 0.70 derating:
PV power = 1,555 ÷ 2.5 ÷ 0.70 = approximately 889W
This result shows why battery and panel sizing must be coordinated. A large battery paired with a small array may offer stored energy initially but recover too slowly after poor weather.
Use reputable solar-resource information for the exact site, panel tilt and design month. Where continuity is important, hourly or multi-day modelling is more useful than a monthly average because it reveals consecutive low-solar periods.
Check MPPT voltage, current and power limits
An MPPT controller must be compatible with the array under the highest possible voltage, highest input current, maximum PV power and required battery charge current. A controller’s headline wattage or current rating does not replace these checks.
For a closer explanation of controller types, review MPPT and PWM solar charge controller differences.
Cold-weather open-circuit voltage
Panel open-circuit voltage rises as cell temperature falls. The controller must tolerate the highest possible string voltage at the site’s minimum design temperature.
Use the module manufacturer’s temperature coefficient where available:
Cold string Voc = module Voc × modules in series × cold-temperature correction
As a purely hypothetical example, two modules with a 24.5V open-circuit voltage and a calculated cold correction factor of 1.12 would produce:
Cold string Voc = 24.5 × 2 × 1.12 = 54.9V
That value must remain below the controller’s absolute maximum PV input voltage, including any required design headroom. Do not use the region’s average winter air temperature: exposed panels can experience different cell conditions, and the correct method depends on the module data.
Array input current
Modules connected in parallel increase array current. A simplified current check is:
Array short-circuit current = module Isc × parallel strings
Any additional sizing factor required by the controller manufacturer or applicable electrical design rules should then be applied.
For example, two parallel strings with an Isc of 11A each produce 22A before any required factor. Confirm both the controller’s permitted PV input current and its short-circuit current limit; these may be separate specifications.
Controller charge-current capacity
The controller’s battery-side output current can be much higher than the PV-side current when it converts a higher array voltage to a lower battery voltage.
A useful estimate is:
Charge current = PV power × controller efficiency ÷ battery charging voltage
For an illustrative 800W array, 95% conversion efficiency and 14.2V charging voltage:
Charge current = 800 × 0.95 ÷ 14.2 = approximately 53.5A
The selected controller must support this current, and the battery must be permitted to accept it. Use the actual charging voltage and efficiency range from the relevant datasheets rather than treating these example values as design recommendations.
Check all of the following:
| MPPT parameter | What must be verified |
|---|---|
| Maximum PV voltage | Above calculated cold-weather string Voc |
| MPPT operating range | Suitable for expected array operating voltage |
| Maximum input current | Compatible with parallel-string current |
| Maximum short-circuit current | Not exceeded under array fault-current conditions |
| Maximum PV power | Suitable at the selected battery voltage |
| Charge-current limit | Enough for array output without exceeding battery limits |
| Battery profile | Correct for battery chemistry and voltage requirements |
| Temperature behaviour | Suitable for battery and controller operating conditions |
Coordinate battery charging and load outputs
The charging system and load side must work together. Even if the array, battery and MPPT each pass their individual calculations, the design can still fail because of output-current limits, voltage drop or incompatible low-voltage thresholds.
Verify:
- Total continuous load-output current
- Per-output current limits
- Peak or start-up current
- Output voltage regulation
- Fuse or electronic protection arrangements
- Cable current rating and voltage drop
- Load disconnect and reconnect voltages
- Whether the load can tolerate the battery’s full operating voltage range
- Controller behaviour during battery protection events
- Battery charge-current acceptance under all expected temperatures
If several devices share a DC output, calculate the combined current rather than checking each device separately. For a nominal 12V load:
Load current (A) = load power (W) ÷ operating voltage (V)
A 72W load at 12V would draw approximately 6A before cable and conversion losses. Long low-voltage cable runs can create substantial voltage drop, so conductor sizing and equipment placement may be as important as battery capacity.
Treat documented systems as complete examples
Maxsol’s CS12060 120W and 60Ah solar system documents a 120W monocrystalline panel, 12.8V 60Ah 768Wh LiFePO4 battery, MPPT controller and three DC12V outputs.
The CS400150 400W and 150Ah solar system documents two 200W panels, a 12.8V 150Ah 1920Wh LiFePO4 battery, MPPT control and four DC12V outputs.
These are system examples, not interchangeable component prescriptions. The documented nominal battery watt-hours do not equal guaranteed delivered energy or runtime. Before selecting either configuration, verify the supplied controller arrangement, PV open-circuit voltage and current limits, battery charging profile, charging temperatures, protection behaviour and load-output limits.
The number of DC outputs also does not establish how much total load the system can support. Per-port and combined current limits still need to be checked against the actual equipment.
Stress-test and document the final design
Before procurement or installation, test the worksheet against credible worst-case conditions. A robust design should show not only the expected result but also what happens when an assumption is unfavourable.
Run at least these scenarios:
- Maximum load: All equipment operates at its highest realistic continuous demand.
- Night-time peak: Cameras use infrared illumination while communications equipment is fully active.
- Low-solar sequence: Several poor-weather days occur with limited charging.
- Battery recovery: The array supports the live load while restoring the planned battery deficit.
- Cold clear morning: Array Voc increases while the battery may restrict charging.
- Hot panel conditions: PV operating voltage and output change at elevated cell temperature.
- Partial shading: One or more modules receive uneven sunlight.
- Cable loss: The furthest device still receives acceptable voltage at peak current.
- Battery ageing allowance: Reduced usable capacity does not immediately compromise the design objective.
- Protection event: The system’s response to overload, low voltage or battery management system disconnection is understood.
Final design record
Keep a dated worksheet containing:
- Equipment list and measured or datasheet power
- Operating schedule for every load
- Daily Wh calculation
- Conversion and cable-loss assumptions
- Autonomy target
- Battery usable-energy assumptions
- Design-month solar input
- Panel orientation, tilt and shading notes
- PV recovery target
- Module Voc, Isc and temperature coefficients
- Series and parallel array arrangement
- MPPT voltage, current and power checks
- Battery charge voltage, current and temperature limits
- Load-output and protection limits
- Cable lengths, conductor sizes and voltage-drop results
- Datasheet versions used in the calculation
Recheck the design whenever the load, panel arrangement, battery, controller, cable distance or operating schedule changes. A small increase in continuous load can add a substantial daily energy requirement because it applies for 24 hours.
The practical next step is to complete the worksheet with site-specific winter solar data and current equipment datasheets. Then compare the linked Maxsol models against the required port count, verified load, cable and wireless distance, power budget, environmental conditions and any monitoring or management requirements.